
How to Read Peptide Chromatograms
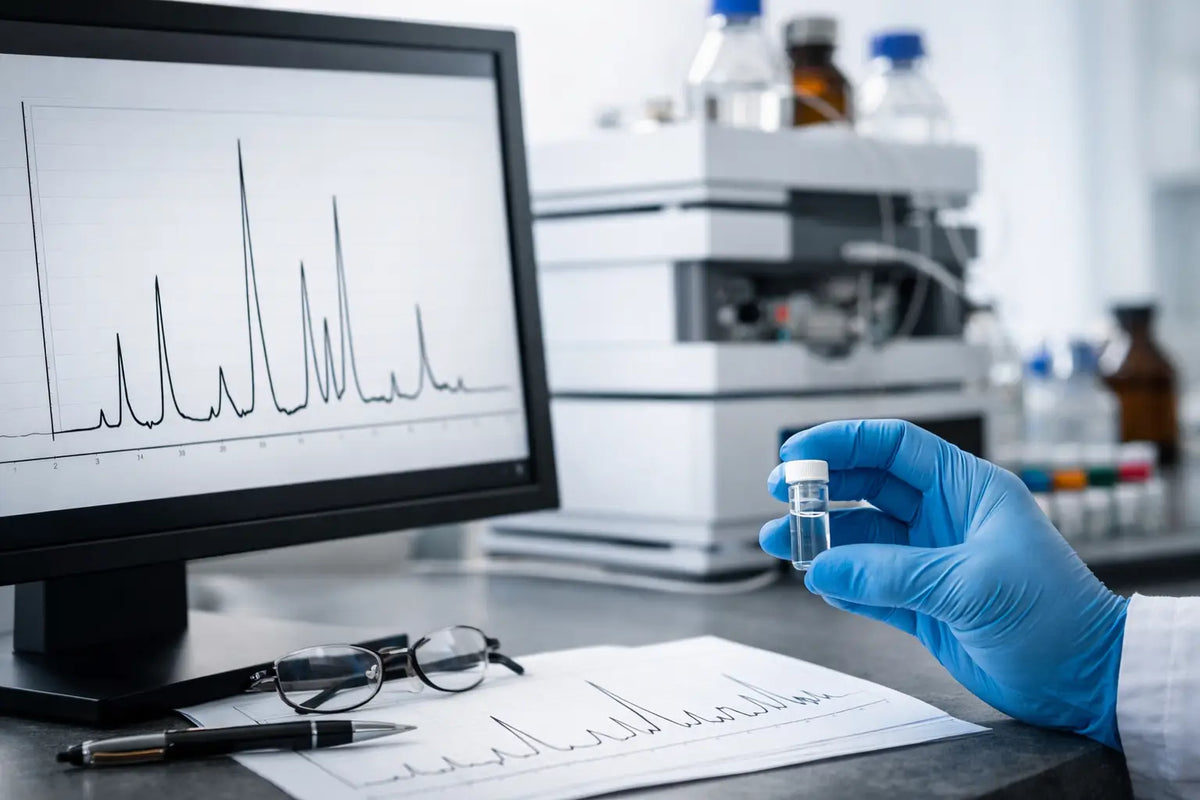
A peptide can be labelled 99% pure, but the real question is what that number actually represents on the chromatogram in front of you. If you need to know how to read peptide chromatograms, you are really learning how to judge peak identity, retention behaviour, impurity profile, and whether a Certificate of Analysis supports the batch rather than just decorating it.
For research buyers, this matters because HPLC data is one of the fastest ways to assess whether a supplier is working to a consistent analytical standard. A chromatogram does not tell you everything about a peptide, but it does tell you a great deal when you know what to look for.
What a peptide chromatogram is really showing
In most peptide CoAs, the chromatogram comes from high-performance liquid chromatography, usually reversed-phase HPLC. The instrument separates compounds in the sample as they move through a column under a controlled solvent gradient. Each detectable component appears as a peak at a particular retention time.
The x-axis shows time, usually in minutes. The y-axis shows detector response, often UV absorbance. A larger peak generally means more of that component is present, but only within the limits of the method used. That distinction matters. Peak area percentages are method-dependent, and they should not be treated as an absolute universal truth across different laboratories, columns, gradients, or detection wavelengths.
For peptides, the main peak is typically the target compound. Smaller peaks can represent synthesis by-products, deletion sequences, oxidation products, residual protecting-group variants, or other related impurities. In a clean batch, the principal peak should dominate the trace.
How to read peptide chromatograms step by step
Start with the simplest question: is there one clearly dominant peak? If the chromatogram shows a single major peak with minimal secondary peaks, that usually supports a high-purity result. If the trace is crowded with multiple peaks of meaningful size, purity is lower or the sample is more complex than the label suggests.
Next, check the retention time assigned to the main peak. This is not, on its own, proof of identity, but it should be consistent with the method and with prior lots tested under the same conditions. A major shift in retention time can indicate a change in method, a formulation issue, sample instability, or that the peak assignment deserves closer scrutiny.
Then look at the reported area percentage. On many CoAs, purity is reported as area per cent by HPLC. If the main peak is listed at 99.0% area, the remaining integrated peaks collectively account for around 1.0% of the detectable impurities under that method. That is useful, but it is still not the same as saying 1.0% of every non-target substance in the vial has been fully captured and quantified. Some impurities may respond differently at the detector, and some may not be resolved cleanly.
Peak shape also matters. A well-behaved peptide peak is usually reasonably symmetrical. Pronounced tailing, fronting, or splitting can point to overload, poor column condition, sample matrix effects, or unresolved components hiding under what appears to be one peak. A single tall peak is not automatically a clean peak.
Finally, review baseline quality. If the baseline is noisy, drifting, or unstable, low-level impurity assessment becomes less reliable. A neat chromatogram with a stable baseline supports cleaner interpretation.
The main features to assess on a peptide HPLC trace
When reviewing a peptide chromatogram, most buyers should focus on five things: the dominant peak, retention time, peak area, impurity distribution, and baseline quality.
The dominant peak should be obvious. If you have to guess which peak is meant to be the product, the data is already less convincing. Retention time should be recorded clearly and applied consistently across batches tested by the same method. Peak area should align with the stated purity claim. Impurity distribution matters because ten tiny trace peaks may carry a different risk profile from one larger secondary peak, particularly if that secondary peak suggests a recurring synthesis or degradation issue. Baseline quality tells you how much confidence to place in the smaller details.
This is where experienced buyers often separate marketing claims from usable documentation. A CoA should not simply state a purity number. It should show the trace in a legible way and provide enough method context to make the result meaningful.
How to interpret purity claims properly
A 99% HPLC purity result is strong, but the phrase is often misunderstood. It usually means the main integrated peak accounts for 99% of the total detected area under the stated chromatographic method. It does not mean the material is perfect, and it does not mean every possible impurity has been excluded by every analytical technique.
That is not a weakness in HPLC. It is simply the correct way to read the data. HPLC is highly valuable for peptide purity assessment, especially when used consistently. But purity by HPLC is one analytical measure, not a complete identity and stability package on its own.
This is also why method details matter. Two laboratories can analyse the same peptide and generate slightly different purity values depending on column chemistry, mobile phase composition, gradient profile, temperature, flow rate, sample preparation, and detector wavelength. Small differences do not automatically mean one result is wrong. They mean chromatography is a method-driven measurement.
Red flags when reading peptide chromatograms
Some warning signs are obvious. If the chromatogram image is too small or blurred to read, the documentation is weak. If the CoA gives a purity percentage without a visible peak table or trace, there is less transparency than serious buyers usually want. If the main peak is broad and irregular, purity may be overstated by poor resolution.
Be cautious if there are unexplained secondary peaks near the main peak. Closely eluting impurities can distort integration and make a sample appear cleaner than it is. Also watch for manual integration that appears overly generous, where baseline boundaries seem drawn to favour a higher purity figure.
Another issue is inconsistency between lots. If one batch of the same peptide elutes at a noticeably different time under supposedly identical conditions, ask whether the method changed. Consistent products should be supported by consistent analytical reporting.
Reading a chromatogram alongside the CoA
A chromatogram is most useful when read with the rest of the Certificate of Analysis, not in isolation. Check the batch number, peptide name, lot-specific purity result, test date, and analytical method reference. If molecular weight or mass spectrometry data is included, that provides another layer of confidence around identity.
For routine procurement, the practical question is whether the supplier’s documentation is batch-specific, legible, and repeatable. ApexLink Peptides, for example, positions its analytical standard around HPLC-verified purity with batch-linked CoAs, which is the level of documentation serious research buyers usually expect.
If a supplier only provides generic example reports, that is less persuasive than a lot-specific analytical record tied directly to the material received. Traceability matters just as much as the headline purity figure.
Limits of HPLC and why context matters
Even if you know exactly how to read peptide chromatograms, it is worth keeping one point in view: chromatography is powerful, but not all-purpose. HPLC can separate and quantify many related components very effectively, yet it does not replace the need for proper storage, handling, shipping control, or batch consistency.
A clean chromatogram from a well-tested batch is valuable evidence. It is not a guarantee against degradation after poor temperature exposure, repeated reconstitution errors, or extended storage under unsuitable conditions. The analytical result reflects the sample at the point of testing under the stated method.
That is why experienced buyers look at the whole supply chain. Purity data, batch traceability, storage guidance, dispatch reliability, and responsive technical support all contribute to whether a peptide is fit for research use when it reaches the bench.
A practical way to review peptide chromatograms quickly
If you are screening supplier documentation, use a simple internal sequence. First, confirm the chromatogram is batch-specific and readable. Second, identify the main peak and compare its area to the stated purity claim. Third, scan for significant secondary peaks or unresolved shoulders. Fourth, check whether retention time and method details are present. Fifth, judge whether the overall presentation looks consistent with a laboratory document rather than a marketing graphic.
That process will not replace full analytical review, but it does help you filter weak documentation quickly. In peptide procurement, speed matters, but so does evidence.
A chromatogram should give you confidence for the right reasons. If the main peak is clean, the impurities are limited, the baseline is stable, and the CoA is lot-specific, you are looking at documentation that supports trust rather than asking for it.
More from the research library.
How to Select Peptide Vial Sizes for Research
Learn how to select peptide vial sizes for research based on assay demand, reconstitution volume, stab...
Read article →
How to Calculate Peptide Molarity Correctly
Learn how to calculate peptide molarity from mass, molecular weight and reconstitution volume, with pr...
Read article →
Can Researchers Verify Peptide Identity Reliably?
Can researchers verify peptide identity? Learn how HPLC, mass spectrometry, batch records and Certific...
Read article →